|
|
在程序框图中容易创建的状态图
- Statechart at the block diagram
- No translation needed
- Local and global states
- Event driven with signaling
- License LGPL (free to use)
- Configuration with LabVIEW Express
Open StateChart by Vogel Automatisierungstechnik GmbH is add-on software for easily creating statecharts on the block diagram in LabVIEW system design software.
A state diagram is used in computer science and related fields to describe the behavior of systems. State diagrams require the system described to be composed of a finite number of states.
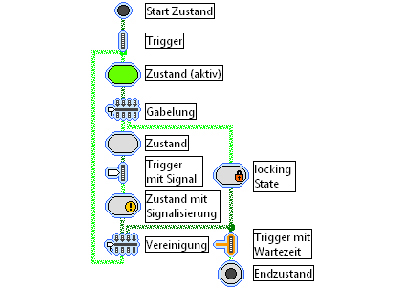
Statecharts are made from the basic design of the following components:
-Initial state in which the object is created
-Finite set of different states that describe the object/system at a given time
-Finite set of events, which in a particular state, for example, occur after a certain time
-Finite number of transitions/state transitions that describe the transfer from one state to the next
-One or more final states in which the object ceases to exist
States: A state is the time between two events. A state is defined by a unique name.
Events/transitions: A transition is a state transition of an object, which is triggered by an event. An event can occur if one or more conditions are met or an object has received an event-triggered message.
|
|


 发表于 2019-5-12 02:45:49

 收藏
收藏
